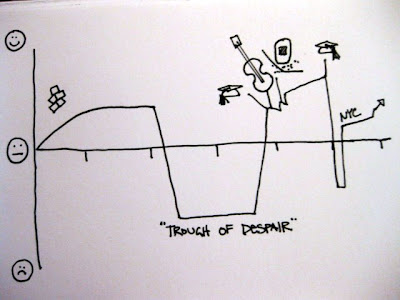
Transparency Camp was great! I facilitated a session on intellectual accessibility and data visualization. The conversation started with the image below:

We continued our discussion for with a meta visualization, laying out the types of data visualizations that are currently out there on a scatter plot with continuum axes. I tend to think about info vis like this, as a matrix of options that fits into different families or categories.

Something really interesting that came out of the conversation was the idea to establish a 'Visualizer Code of Ethics'. It was clear from our discussion that Information Designers such as myself can feel just as much pressure to massage our visualizations as do data analysts and statisticians. I think the challenge in a code of ethics is that a visualization relies on the story or message of the analysis. I've become increasingly conflicted regarding the use of pyramid and 3-D pie charts. I've always loathed their use, but what's the point of a graphic? If you think about the continuum of visualization methods above, statistical graphics are one small part of a universe of visual communication techniques. I've seen people painstakingly massage venn diagrams into the appropriate area relationships to represent percentages, and I have to ask, what's the point? As a concept graphic, a venn's purpose is to demonstrate intellectual relationship. If you're trying to show precise proportional relationship, there still isn't anything better than a bar chart. (Linear differences are so much easier to see than area differences.)
Maybe a good place to start with an visualization code of ethics is "know the purpose of your data".
No comments:
Post a Comment