9.16.2010

Location's Fourth Dimension

While I was prepping for the Minnesota State Fair edition of the Foursquare Traffic Report, it became apparent that a fourth dimension is noticeably missing from the current discussion about location.
Those of us who work with location-based data know what a pain it is to define where something is. We start with coordinates on the globe, a single point on a quasi two-dimensional plane. From there we look at area, but is that enough? Do we define the Minnesota State Fairgrounds as a single instance of coordinates? What about locations that are within the boundaries of the grounds?

Over the course of the Minnesota State Fair There were over 200 unique venues used within the Minnesota State Fairgrounds. Only 12 were duplicates, and nearly half of the checkins came from a single venue, the 2010 Minnesota State Fair. 
The 2010 Fair itself is a more popular venue than the fairgrounds. How often does when trump where?  If someone checks in from Austin, TX the second week of March, chances are they're at South by Southwest. Which of the expansive list of venues are they going to use? I'm willing to bet that a popular new venue will show up in early March called 'SXSW 2011'. 
As more and more people use location-based services we'll see more 'temporary venues' based around events. Right now Foursquare has pages for venue owners. What happens when several 'temporary venues' exist within a larger venue? Does this change the way venue administrators look at managing their traffic data?

6.08.2010

A word about predictive advertising.

For those of you who don't know, I recently got engaged. It was broadcast to the world via a status change on Facebook about a month ago, and now I get the strip of ads to your right.  I'm pretty sure Dan isn't getting these kinds of ads. It's a little annoying. So, a word about predictive advertising. Yeah, I get it Facebook, you need to monetize, so why not go the google route and ad it up? I'll tell you why: when I'm on Facebook, I'm not looking for unique bridal dresses or bridesmaid gift ideas, nor am I looking for tooth whitening services or the latest trends in bridal styles. I'm not even looking for those things on Google, in fact, I'm not looking for those things at all.

Given my DIY ethos, I am not interested in ordering unique, personalized gifts for my maid of honor and bridesmaids, who are the marriage police that dictate that I should even have bridesmaids? Why be gendered about it? I'll make them something myself and spare those standing up for me your tacky impression of what a wedding party should be thankyouverymuch. As it turns out, my mother will be sewing my dress. I'm working up sketches for her right now. My fiancee has been making me a new engagement ring every day, mainly because I don't wear many accessories in general and he couldn't figure out my ring size (hard to find a ring size when your GF doesn't own rings). So my word about predictive advertising is that it's not so predictive after all, and really pretty superficial. End rant.

6.04.2010

Circuits and Sensors and Code, oh my!

Over the last two days I attended two very different workshops at itpcamp. Both involved circuits and sensors, but the latter of the two included a programming environment. The contrast between the two sessions was dramatic.

In the first session (lead by Stephen Lewis) we looked at the KEAD6 from Hagstrom Electronics (the photo here is taken from their site). What a simple little board! It comes with a clear user manual and a program for windows that allows you to program sensor inputs to output keystrokes. How great is that! The nice bit is that you can control a simple game with a up to six sensors rather than your keyboard. you can set anywhere from two to 32 different levels of input for your sensors, depending on their range. Stephen helpfully pointed out that if for nothing else, it makes a great tester board for when you're buying sensors.

The benefits: No code! It can be intimidating to learn a new programming environment, especially if you've never done any programming before. the KEAD6 lets you get up and go in less than 20 minutes. Within our two-hour session we played with a bunch of different sensors.

The drawbacks: it must be tethered to a usb device for power. Also, the software for the keystroke setting program is only available in Windows. The board itself after it's been programmed will run on a mac, but the programming itself must be done on a windows machine.

Our second session (lead by Tom Igoe) covered the basics of the Arduino microcontroller (the photo here is by Nicholas Zambetti from the Arduino.cc site). I was recently gifted the Arduino starter kit by my magnanimous mate, so I was able to play along through the presentation. In our three-hour session we covered basic electronics, talked about different types of circuitry, and created some basic interactions in the Arduino programming environment.  Over the course of our three hour session the number of attendees dwindled from 40 to around 25. Working with the Arduino board was much more complex than the simple KEAD6, but the increase in complexity is mainly due to the vast increase in flexibility. Sure, you need a better understanding of electronics and you need to know how to code, but you can do much more than control simple keystrokes. (although you can do that, too if you'd like).

Both are great boards, full of possibilities. I think the KEAD6 is a bit more accessible for beginners, but whether you like it or not, to do anything really specific, you'll have to learn how to program, even when using the KEAD6. There's a part of me that thinks that simple programming education should be compulsory.

6.01.2010

Fire!

I'm feeling pretty inspired after my first night of ITP. I attended Lawrence Lenihan's presentation entitled "Ready, Fire! Aim." That man has got some great swagger! It was a great glimpse into the logic of a VC who specializes in tech investments. The key message was this: failure is cheaper than planning. For software technology, I have to agree. Hard product development, however, is an entirely other kettle of fish. Web tech doesn't need a business plan, but brick and mortar businesses will always require a roadmap.

ITP Camp

ITP Camp starts today and I'm totally stoked for a month-long marathon of geeky goodness. My project will be focusing on meta-visualzation, probably using Processing, but who knows? I think it would be cool for Open Data Wiki to have a widget that shows the types of visualizations that work well with the types of data shown, or maybe an collaborative interface for categorizing information, like a simple virtual card-sort exercise.

June is a red-letter month for BitsyBot Labs. I moved into my space at SoHo Haven this morning. It's so good to have a working space without feline or televised distractions.

5.31.2010

James Squire Guide to Beer

I love the way visualizations simplify decisionmaking. On a recent trip to Sydney I had dinner at James Squire, and when deciding which of their signature beers to pair with my meal, the following chart made my task a lot easier: 
It brought to mind this lovely number that was on display last year at Bobby Van's Steakhouse in Manhattan:
I find so much power in a simple two-axis matrix for choosing within a set of products. I'd love to see more services do this type of presentation to help consumers navigate the sometimes overwhelming choices that they are faced with. I've been thinking these types of presentations in the context of The Paradox of Choice by Barry Schwartz and Nudge by Thaler and Sunstein. Does this type of visualization make increasingly complex decisions easier to navigate? I tend to think so. I like an aromatic beer, with savory undertones, so I should choose an ale rather than a lager. Rather than struggling to identify the nuances between the myriad of beer choices, I'm given a useful map. What other types of choices can be simplified by a little visual design? I'd wager the categories are endless. It highlights to me the importance of empathy in design. If the first mantra of the information designer is to know the purpose of your data, the second may be to respect your audience. Be aware that as a designer you're steering them to a product, you may as well steer them to the product they're going to like the most. 

5.24.2010

Any sufficiently advanced technology...

...is indistinguishable from magic.

Bintsley recently acquired a magic wand (courtesy of cdibona). It requires a bit of practice, but it adds a skill-building aspect to lounging on the couch. Programming the wand wasn't nearly as tedious as I'd thought it would be.

The tactile cues are fascinating. It makes me think about how hardware-software interactions give the opportunity for richer feedback, but are seldom used. My guess is it's due to the difficulty of deciphering physical codes. We are a primarily visual species. Arrows mean pretty much the same thing in nearly all human cultures, but the difference between two pulses versus one pulse of vibration must be learned.

3.31.2010

Transparency Camp

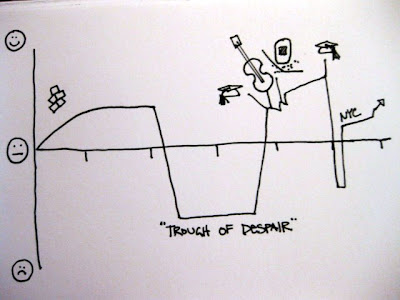
Transparency Camp was great! I facilitated a session on intellectual accessibility and data visualization. The conversation started with the image below:


Right off the bat, Brian Behlendorf from Health and Human Services guessed that it was happiness over the course of a person's life. Totally threw me for a loop (as I've never presented this graphic before). Apparently the "Trough of Despair" (a.k.a. middle school and high school) is a little hard to miss. I think it still works as a demonstration of the power of context and storytelling, tho.

We continued our discussion for with a meta visualization, laying out the types of data visualizations that are currently out there on a scatter plot with continuum axes.  I tend to think about info vis like this, as a matrix of options that fits into different families or categories. 
I'm kicking myself a little for not documenting the results of our discussion better. Never again shall I neglect to take pictures!

Something really interesting that came out of the conversation was the idea to establish a 'Visualizer Code of Ethics'. It was clear from our discussion that Information Designers such as myself can feel just as much pressure to massage our visualizations as do data analysts and statisticians. I think the challenge in a code of ethics is that a visualization relies on the story or message of the analysis. I've become increasingly conflicted regarding the use of pyramid and 3-D pie charts. I've always loathed their use, but what's the point of a graphic? If you think about the continuum of visualization methods above, statistical graphics are one small part of a universe of visual communication techniques. I've seen people painstakingly massage venn diagrams into the appropriate area relationships to represent percentages, and I have to ask, what's the point? As a concept graphic, a venn's purpose is to demonstrate intellectual relationship. If you're trying to show precise proportional relationship, there still isn't anything better than a bar chart. (Linear differences are so much easier to see than area differences.)

Maybe a good place to start with an visualization code of ethics is "know the purpose of your data".

3.11.2010

Google Public Data Explorer


I made the chart above using the new Public Data Explorer from Google. It doesn't have the capability to upload your own data set yet, but it's still pretty nifty. As is usually the case, the way the data set is structured has a huge impact on the ease of analysis. Some of the data sets have better categorization than others, and it isn't possible to select a whole set of variables at one time, which would be nice. As tools go, it's really easy to get the html needed to embed in any website. The base visualizations are really clean, which is fantastic, but the tool doesn't give much flexibility in terms of combining seemingly unrelated data sets (like showing rate of unemployment and HIV infection on the same chart). I'm looking forward to seeing how Google will handle the data uploading issue, as well as the continued development of the data files. Nat Torkington just wrote an illuminating post on open data formatting issues. I hope that (as he suggests) open data will follow in the model of the open source community.

3.09.2010

UPA Usability Metrics Workshop

I went to a great UPA workshop last month, presented by Bill Albert and Tom Tullis. It was a jam-packed day, covering a nearly overwhelming amount of content. Tom and Bill walked us through an overview of metric types and collection methods, and then concentrated on four different types of metrics: Performance, Self-Reported, Combined, and Observational.

One thing that struck me was the relationship between these metrics as they were presented. Performance and Self-Reported metrics are both gleaned through a structured interaction with a sample set of users. Combined metrics give an overall view of the health of an interaction, and are calculated using both Performance and Self-Reported metrics. Observational metrics are used less often than Performance metrics, and are seldom used in a Combined metric format.

Given that I've been working within a traditional survey-based market research environment for the past four years, I found the combination of these different types of performance indicators very interesting, especially given the practice of using self-reported data to create derived KPI (key performance indicators). It struck me that our rapidly changing access to data has the capacity to completely overhaul the way we approach measuring the success or failure of a product. Ultimately we must be able to demonstrate a profitable return on investment, but what happens when we have larger data sets to work with? Can we combine post-launch observational metrics with pre-launch performance tests to validate continuing development?

Market research and usability have their roots in the production and sale of products, not services. As we shift focus from the production of meatworld goods to the design of online services, we suddenly have the ability to approach larger and more disparate groups of consumers. With agile methodologies creating ever shorter development cycles, we have more opportunities to use our user communities as test subjects for working services. Google has famously tested 41 shades of blue for one of its toolbars, measuring click through rates to determine which shade is most appropriate. Services like Clickable provide the ability to make immediate decisions about search advertising ad copy. Users can see the real results on their pay per click online ads and use that information to refine their messaging (compare that to a six-week messaging study).  Granted, this is easy to do in a low-cost medium with infinite dimensions. (When a prototype takes at least a year to develop and costs at least a million dollars to produce, the barrier to this kind of live experimentation is high). Happily, we're living in a new age now, where interfaces and services and messages are expected to shift and grow and refine with changing consumer demand.

So what does this mean for usability metrics? For virtual services we will need to find a way to integrate those traditional metrics with live Observational metrics. Heck, we could even create a way to automate this type of reporting. I've got some ideas on how to do this, but that will have to wait for another day.

2.21.2010

Sausagefest 2 - Now with Potatoes!

After last weekend's sausage success, we swung back to The Meat Hook for a second round. This week's stars: merguez, red wine rosemary, chorizo, garlic, and boermors. If there's any regret I had with last week's adventure, it was the unused fat that fell to the bottom of the drip-tray after broiling the sausages. To improve on our sausage tasting we hit up the Union Square farmer's market on the way home to pick up some root vegetables. It being the lean time of year for local produce, we snagged a beautiful bag of potatoes.

I decided to do a little trick shown to me by Nick Fauchald, editor of The Tasting Table. If you don't have a wire rack for roasting meats, use some root vegetables instead! As the fat renders out of your protiens, it bathes the starchy veggies in a coating of delicious.. Wanting to keep the integrity of the flavors of each sausage, I made little aluminum foil boats for each link, filling the bottoms with quartered purple and gold potatoes.

Just like the brussels sprouts last week, I didn't salt or pepper the veggies. I let the sausages impart their unique flavors to the potatoes while roasting in a 450 degree oven. Halfway through roasting I flipped the sausages.

We followed a better tasting order this time, starting with the milder links. The red wine rosemary and garlic sausages were nice, but a bit milder than I'd like. (After last week's revelations my bar has gotten quite a bit higher.) Neither of these sausages rendered near as much fat as the merguez or the chorizo. The big surprise this week was the boermors. Imagine a sausage that tastes like a meaty glass of scotch. Seriously, it tasted of pork and beef, with smoke at the start and oak at the finish. Delicious! After the boermors we finished with the chorizo and merguez for dessert. The chorizo was nicely balanced, not too much heat, not too much spice with lots of complex flavor. They imparted a nice flavor to the potatoes they were roasted with, but the winner this week was the merguez. The merguez potatoes were fantastic! All in all, a great sausagefest.

OK Trends continues to kick ass

It looks like the folks at OK Cupid are paying attention to their critics. As I've mentioned before, their analysis is inspired, but their data graphics need some work. Case in point, this post about profile photo myths. The graphs had a lot of rookie mistakes.

For Example... the chart on the right was taken from OK Trends, and there are a number of problems. It's always a good idea to eliminate all unnecessary data pixels. The outlines around the bars of these charts provides some visual distraction that can easily be eliminated. In addition, the legend requires a bit of ocular calisthenics. Your brain only keeps five to nine bits of information in short-term memory. In order to read any chart you need to understand the numbers and the context. The further you remove the context from the numbers, the more your brain has to work to put the pieces together. In this example the numbers in green at the top of the chart can't be understood until you read the title at the top of the chart and the legend at the bottom. In the western world we read from left to right, top to bottom, but this chart forces the viewer to read the top, then the bottom, then side to side. While the green data series is the first you encounter with your eyes, it's the last that's listed in the legend.


My version of the chart is on the right. Notice the legend is on the right of the chart, in the same order as the data series. Your eye reads left to right, the way it naturally wants to. I added an axis showing the sum of all the categories, so you don't need to do the mental math to know that these are parts of a whole population. In addition, the unnecessary outlines around the data series have been removed.

What I find interesting is the use of a stacked column chart. I think sometimes the impulse is to use a stacked column chart to show data that adds to 100%. I tend to use stacked column charts when I'm showing categories on a continuum. At times it may be better to show the information in a clustered bar chart, like the next one shown here. It depends on what you're trying to express with the data graphic. All of these charts contain the same data, but the last chart makes it easier to see the differences between men and women when it comes to profile pictures. It also makes it easier to see relative differences between categories.

I'm really impressed with the improvements that OK Trends employed in their most recent post. They're employing a wider variety of visualizations, and the graphics they're using are much more sophisticated. If you look at the fourth chart I've posted here, the information is presented in a more manageable form. Grid lines have been provided for quick and easy reference, there's a label indicating the sample size, and the labels are all oriented so they can be read left to right. It makes me really happy to see their data graphics rise to the quality of their analysis.

2.15.2010

Sausagefest

I am a firm believer that the world needs more well-crafted sausages (and food in general). When I worked as a cook at Concordia Language Villages, I would sometimes encounter kids that were more comfortable eating bologna than eating roast pork loin (they often called themselves 'partial vegetarians'). I like to think that those kids still believed in 'the meat faerie', more comfortable not knowing what they were eating. Then there were the other kids who were totally skeeved out by cold-cuts, not wanting to eat 'lips and assholes'. From where I sit, I'd be more concerned about the fillers that get added to any type of mystery meat. Why try to remove yourself from knowing what you consume? I suppose it's the nature of the distance we seek to create from our collective environment. It's easier to consume without consideration for the effects that our demands have. At the end of the day, an animal died to take center stage on your plate, don't we owe it to ourselves to make as many tasty consumables from that animal as is possible?

That being said, I'm incredibly excited about the charcuterie that's happening over at The Meat Hook. We picked up a sampler pack of all the sausages they carry yesterday and had a little tasting for brunch.

Tom Mylan helpfully listed out the flavors we acquired on the package. I opted to roast the weiners in the oven rather than pan-fry or boil. I wanted each tubesteak to maintain it's identity through the cooking process. I think we did a 350 oven for 10 minutes or so. I wasn't fully awake and often cook by smell and sound.

From left to right we have: merguez, parm parsley, rabbit, green chorizo, chicken w/ herb, and lamb w/ rosemary.

Let me preface the review by saying that they were all delicious, some of the best sausages I've ever had, but there were two that I clearly preferred, the merguez and the green chorizo.

We started with the merguez, which in hindsight may have been a bad idea. I'm a sucker for spice, and this sausage did not let me down. It was sweet and salty, and had a nice finish. The parm parsley had a nice depth of flavor. It wasn't as cheesy as I'd expected it to be, which was nice. The rabbit fell a flat for me, especially compared to the others. I probably should've started with the rabbit in order to fully appreciate the mild nuances it brings to the table. The green chorizo was the big winner for me. It was fresh and springy and made me think of an herb salad, truly unexpected. The chicken with herb was easily the best chicken sausage I've ever had. I like to stick with classic pork sausages for the most part, but this chicken was juicy and flavorful. It tasted really, well, chickeney, but it had a great mouthfeel that is often lacking from chicken sausages. The lamb with rosemary was good, but it just didn't have a hope of being as good as the merguez, and as it was later in the tasting, it wasn't as juicy as I would've liked. All in all, I give the collection an enthusiastic thumbs up, and I'll certainly be back for more.

I love meat

Anyone that knows me knows this.

Yesterday Dan and I visited the Meat Hook and I must say I'm smitten. We picked up a lovely dry-aged steak for two, and opted for a sampler of all their house-made sausages (as well as some house-cured kimchi, a favorite of mine).

Dinner last night


The helpful guys behind the counter gave our steak a nice salt and pepper on each side, so we were good to go as soon as we got home.  I opted to pan-sear each side and the finished in a hot oven (450 degrees). The whole operation took maybe twenty-five minutes (five minutes each side, five in the oven, ten to rest). I prefer my steak on the rare side, just heated through, really. It was DELICIOUS! Nice and meaty, with that extra tenderness and sweetness that comes with the dry aging. The fat rendered really nicely. There was a good crust with a creamy, candy-like texture on the inside.

On the side we rocked some serious brussels sprouts and a green salad. For the sprouts I cleaned and quartered enough sprouts to put a single layer in my trusty 8x8 pan. Tom (our butcher) included two smoked sausages, a Kielbasa and an Andouille. I usually use my reserved bacon drippings for roasting vegetables, but as this was a special occasion I decided invite the Andouille to the party. No salt, no pepper, no additional fat, just the sausage and the sprouts.


A quick trip in the 450 degree oven resulted in the sweet-salty ambrosia you see at your right. I don't normally roast veggies so hot, but from now on I will. There was a good bit of caramelization on the sprouts, and the sausage provided ample fat and flavor.

If you get the chance, I highly recommend swinging by the Meat Hook. I know I've found my favorite place for flesh in NYC.

2.13.2010

The internet is a beautiful place

I'm not sure if anyone else saw this post over at ReadWriteWeb. If not, you should give it a gander.

It occurs to me that this reveals something that we as designers and developers need to be reminded of from time to time. The internet is big, (like really, really big) and inherently unfamiliar, with a constantly changing map and unreliable landmarks.


I am reminded of a project I worked on, designing a food-related tool for the Japanese market. When creating a tool for a particular market, it's always important to understand both the physical and intellectual environment that the tool will be used in. I designed a collapsible bento box that can be stored in its wrapper, hung up on a wall. Does this product make sense in Agrestic, CA? Not at all, but for a Tokyo apartment, you bet!


The meaningful bit here is that when designing for the web, we sometimes become so focused on designing and developing for ourselves, or for early adopters, that we forget what happens when someone navigates by landmark. It's a shift from the intellectual environment that we expect. Take this map from Ryuch on Wikimedia Commons:
If the terrain of the Zhongshan Scenic area is unfamiliar to you, the landmarks are given helpful visual references. In other words, if you're trying to get to the big blue and white building at the center of the map, and you aren't seeing it, you're clearly not in the right place.

What does this have to do with the frustrated folks at ReadWriteWeb? I really think there are two things at play here. One being the intellectual environment of the user (which we can't control) and one being the information that we give to the user. We can't control the way that people navigate the web, but we can give them better (or at least more consistent) landmarks to go by.

Let's consider the most popular websites to be landmarks for the web: Google, YouTube, Facebook, MSN, Twitter, eBay, Hotmail, CNN, AOL. (I'm not including any porn here, sorry folks). What happens when the facade of these services changes? For those of us who are web savvy, we take a look at the URL, assure ourselves it was just another re-design, grumble about the old light bulb being so much better, and go on our merry way. What about those people that know where they are in downtown Brooklyn by finding the Williamsburg Savings Bank tower? Confusion! Chaos! Frustration! (These, by the way, are the people who are still using IE 6, not because of laziness, but because of comfort.) I think it's easy for us to laugh at these clueless rubes who can't seem to figure out that ReadWriteWeb isn't Facebook, but really, how are they supposed to know the difference? They're navigating still unfamiliar waters, taking the long way around because it's what they know, and the don't particularly care that there's a more efficient way.

The lesson here? Sure, make improvements, but what's wrong with sticking to familiar interfaces? Users don't like change, so make little changes on a regular basis. The older I get the more I admire the design that is taken for granted.

1.27.2010

OK Trends

I can't even tell you how much I love the activity over at the oktrends blog. Every post is pretty near perfect if it weren't for one glaring thing... the charts are TERRIBLE! Between the angled labels, outlined data series, and inconsistent treatment of typography, I'm too distracted by the charts to really get through the content. My twitchy mouse hand wants to get in there and clean them up.

It's times like these that I have to recognize that perhaps I'm more sensitive to the teachings of Tufte than is absolutely necessary, or maybe even productive. Being a data visualization purist comes with its own set of blinders. The fact of the matter is that the visual information being presented doesn't have to be perfect. It's a rather small sub-set of the audience that will even notice the hammy graphics. If the exercise is to craft a compelling story with a great observational data set, the oktrends blog continues to garner my respect and admiration.

12.08.2009

Data Visualization Bundle

So I've put together a data visualization bundle in Google Reader for any and all interested in the nerdier side of design. Enjoy!

11.09.2009

My first sketch

So I just uploaded my first processing sketch to Open Processing. I finished the first three chapters in the Shiffman Processing text, so stay tuned for more sketches!

11.05.2009

Resonate Revisited


Oh the horror of those things languishing in the deep recesses of the storage spaces in my apartment. The truth is, I nearly killed my sewing machine putting this little beauty together, and am loathe for a repeat performance.

What you're looking at the top is a four foot by five foot flannel quilt, embedded with twenty 2-inch speakers. Those little puffs are constructed with box pleats, spacious enough for some poly fil and a maybe a speaker.


I slept under this blanket for a year, until the stitching between its twenty panels started to deteriorate from the strain. The pleating technique used one square yard of fabric to make one square foot panel. Add to that twenty pounds of fluffy stuffing and the heft of twenty speakers, and you've got a lot of pressure on the hand-stitching that kept the panels together. I tried stitch it all together with my sewing machine, but we're talking about eight layers of some pretty substantial fabric. I resorted to sewing it by hand, a project I always mean to take up again, someday. For now the separate components are stashed in the storage spaces in my apartment, laundered and waiting for a rainy day or rainy season, perhaps? The speakers have been glued into clear plastic orbs, in the hopes that a bit more space between the fluff and the diaphragm will allow for better sound output. I did some experiments with pillows embedded with speakers, and it seemed to work alright, though I may need to find a better speaker than the little 8 ohm piezos I picked up from American Science and Surplus.

Haven't you ever wanted to wrap yourself in a song?

11.04.2009

American West Revisited


I've always been fascinated by toy weapons... so much so that I did a re-branding project with American West caps when I was in design school.

My main memory of cap guns from childhood was watching a boy at music camp unrolling the paper caps and popping them on a piece of smooth cement with a rock, savoring the sulfur smell as he struck each powder dot.

The toy itself seemed so wasteful to me, with its vacuum formed plastic and cardboard packaging. In my revision, I like to think that some outlaw kid would staple the package to a belt they 'borrowed' from a parent and drape it across their chest like a bandoleer, given the opportunity. On the other hand, being uncomfortable with giving children toy weapons I kept with the old west theme, but surreptitiously played with the logo. (Note the surrendering American West figure at the center of the target/badge).

It's never seemed right to me to give a pretend deadly weapon to a kid. Let them make their own, I say.